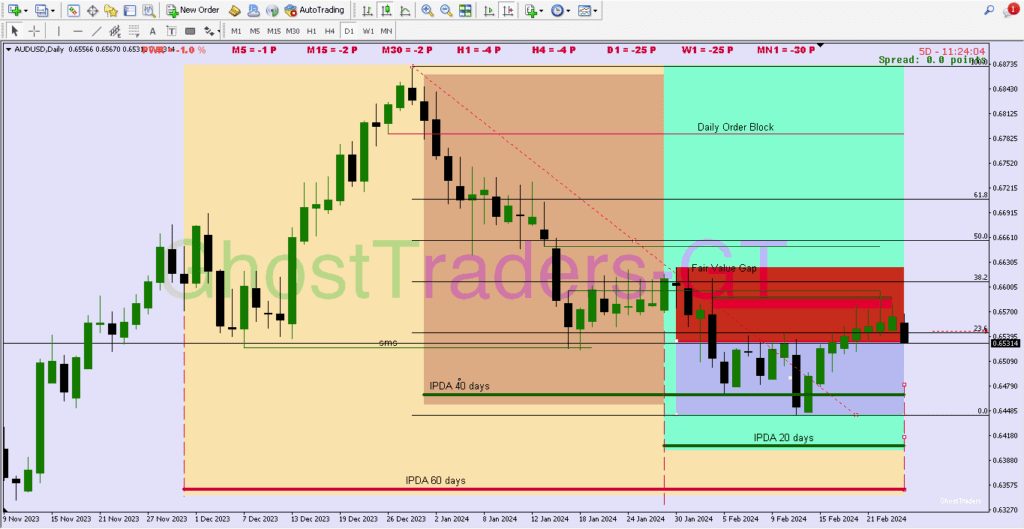
The term “IPDA in forex” refers to the Interbank Price Delivery Algorithm. This algorithm utilizes the past 20, 40, and 60-day periods as benchmarks for identifying particular significant price levels and associated PD arrays. Focusing on the 20-Day Look Backbox can be particularly valuable for intraday traders as it allows them to observe imbalances and points of interest. On the other hand, swing traders may find referencing the 40 and 60-day intervals more beneficial.
IPDA data range
The IPDA data range serves traders by pinpointing the next Draw on Liquidity (DOL) and institutional reference points for trade opportunities, such as fair value gaps and order blocks. It also identifies market equilibrium points, clarifying whether the market is at a premium or discounted state. These insights aid in optimal trade entries and understanding market structure shifts.
Course Bundle
Up To 50% Off
Access all courses with a once-off purchase.
Benefits

Using historical data, the algorithm detects buy stops above the highest high and sell stops below the lowest low over the past 60, 40, and 20 days, indicating potential future price movements. IPDA primarily assists traders in establishing directional bias, predicting where price is likely to go and which internal and external ranges it may target.
IPDA Look Back
As a trader conducting analysis, it’s essential to consider a look-back period of 20-60 days, depending on your trading approach. For swing traders, focusing on the past 40-60 days (excluding Sundays) is ideal for identifying swing trade opportunities.
On the other hand, day traders should concentrate on the last 20 days of trading (excluding Sundays) for day trading setups. Utilizing the “IPDA’ look back can help establish directional bias on higher time frames before shifting to smaller time frames for more precise entry positions.

IPDA With Premium vs Discount in Forex
Equilibrium is a term used in trading to refer to the price level at which the supply and demand for a particular asset are equal. It is the point where buyers and sellers agree on a fair price for the asset. In other words, it is the price level where there is no pressure to buy or sell the asset. but in this case, we are referring to equilibrium as 50% of the Fibonacci level when measuring the defined range of our IPDA Data.
This means if we work within the 20-day IPDA Data Range we will mark the highest high and the lowest low and measure using our from the lowest low to the highest high to find our equilibrium within that range which will be 50% of our fib level.
Discount and Premium Levels in Forex
At discount levels, there’s a strong likelihood of encountering buy setups, while at premium levels, sell setups are more probable. This is because at premium levels, prices are elevated, potentially reducing demand and causing a price decline. Conversely, at discount levels below our equilibrium point, prices tend to be lower and are likely to rise due to increased demand. This fundamental interplay of supply and demand explains why sales opportunities are finite.

When looking for buy or sell opportunities, it is important to keep in mind the overall trend of the market and the price action on both larger and smaller time frames. While buy setups may still occur at premium levels, it is generally more profitable to look for sell setups at these levels. On the other hand, at discount levels, it is generally more profitable to look for buy setups.
It is important to note that these are general guidelines and that each trading situation is unique. Traders should always conduct their analysis and use their judgment when making trading decisions.

