The Hidden Power of Order Blocks
In the world of forex trading, few concepts are as powerful yet misunderstood as order blocks. These special chart formations represent the footprints of institutional traders, the banks and hedge funds that move markets with their massive positions. While retail traders focus on indicators and common patterns, professional traders build their strategies around these institutional zones.
This comprehensive guide will reveal everything you need to know about order blocks: what they are, how to identify them, and most importantly, how to trade them profitably. Whether you’re a beginner or an experienced trader, understanding order blocks will give you a significant edge in the markets.
What Are Order Blocks? The Institutional Perspective
Order blocks are specific candles on your chart that represent areas where large market participants have placed significant orders. Unlike traditional support and resistance zones, order blocks offer precise entry and exit points based on institutional trading activity.
Definition: An order block is a price area where major banks and institutions have placed substantial buy or sell orders, creating imbalances in the market that lead to predictable price movements.
There are two types of order blocks you need to understand:
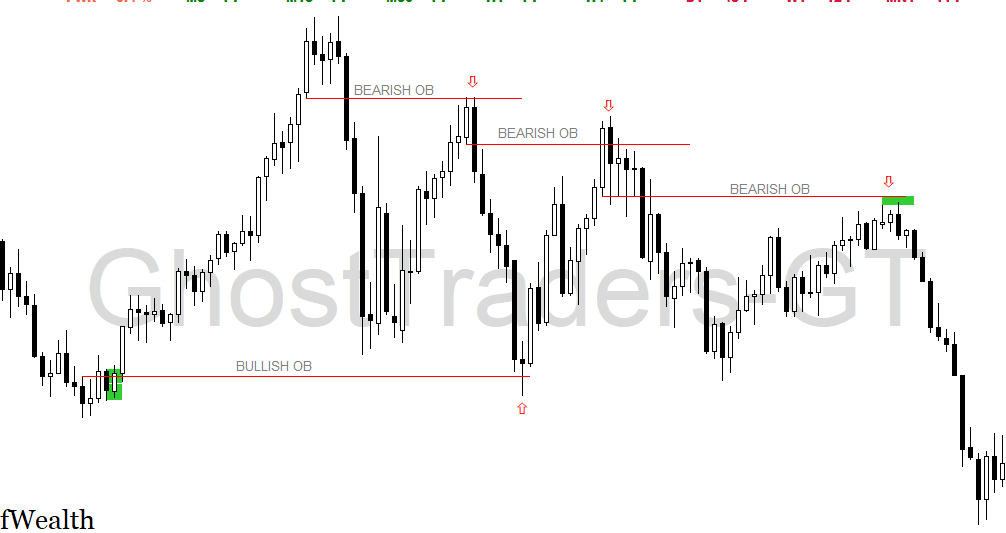
Bearish Order Blocks
- The last bullish candle that forms the highest high before a significant downward movement
- Represents where large sellers have placed orders
- Provides resistance when price returns to this level
- Creates opportunities for short (sell) positions
Bullish Order Blocks
- The last bearish candle that forms the lowest low before a significant upward movement
- Represents where large buyers have placed orders
- Provides support when price returns to this level
- Creates opportunities for long (buy) positions
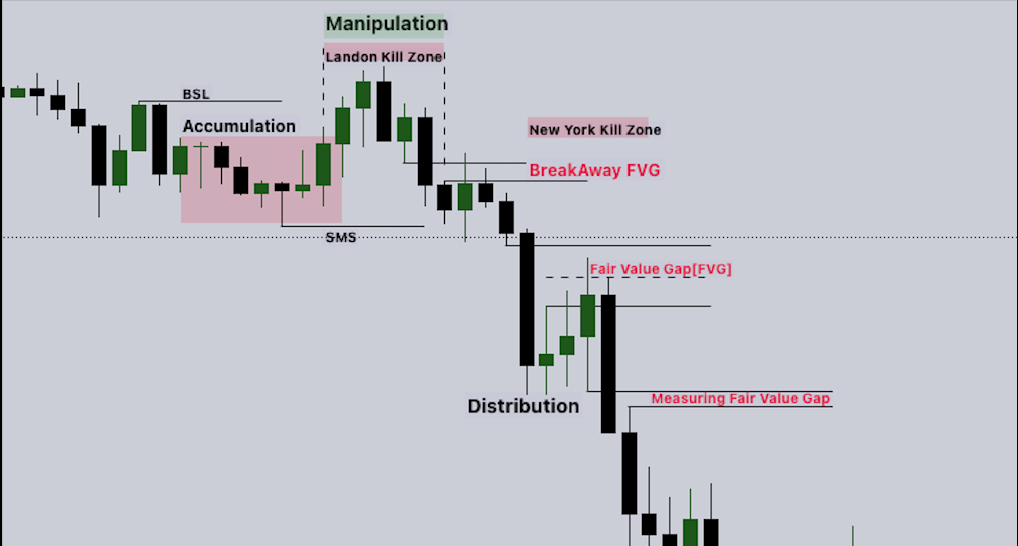
Think of order blocks as the “crime scenes” of market manipulation—they show exactly where smart money has engineered price moves to collect liquidity from retail traders.
The Science Behind Order Blocks: Why They Work
Order blocks aren’t random chart patterns—they represent the strategic positioning of institutional traders. Here’s why they consistently influence price:
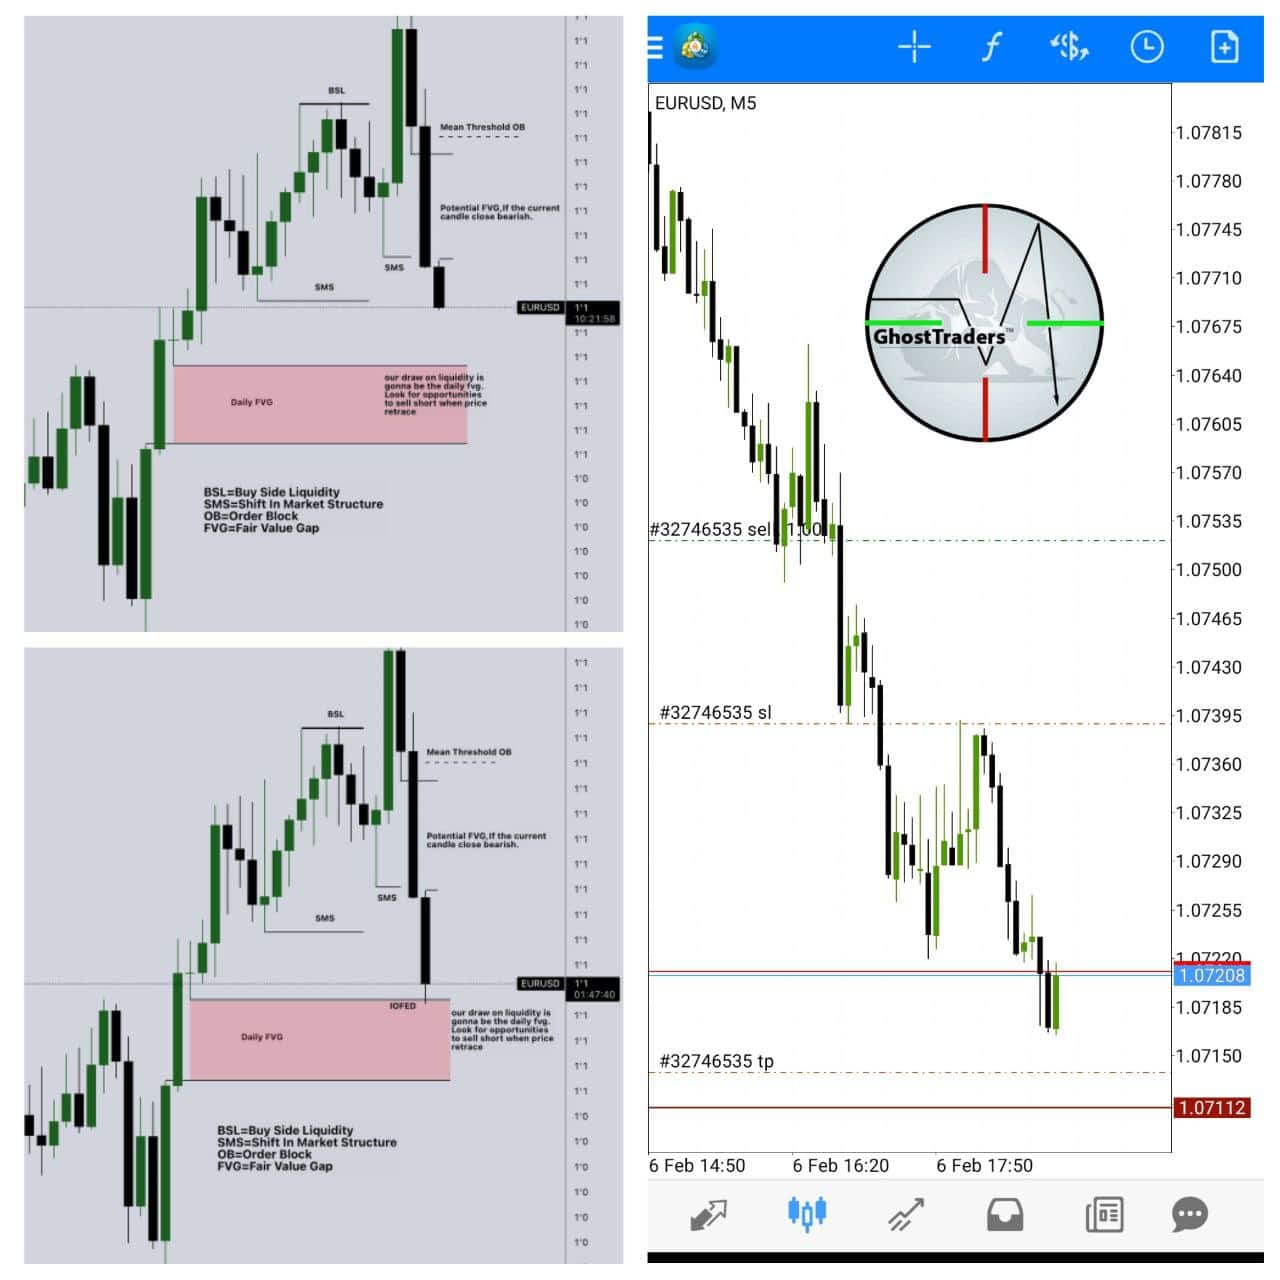
- Liquidity Hunting – Institutions need substantial liquidity to fill their large orders. Order blocks mark areas where they’ve created imbalances to attract retail traders before making their move.
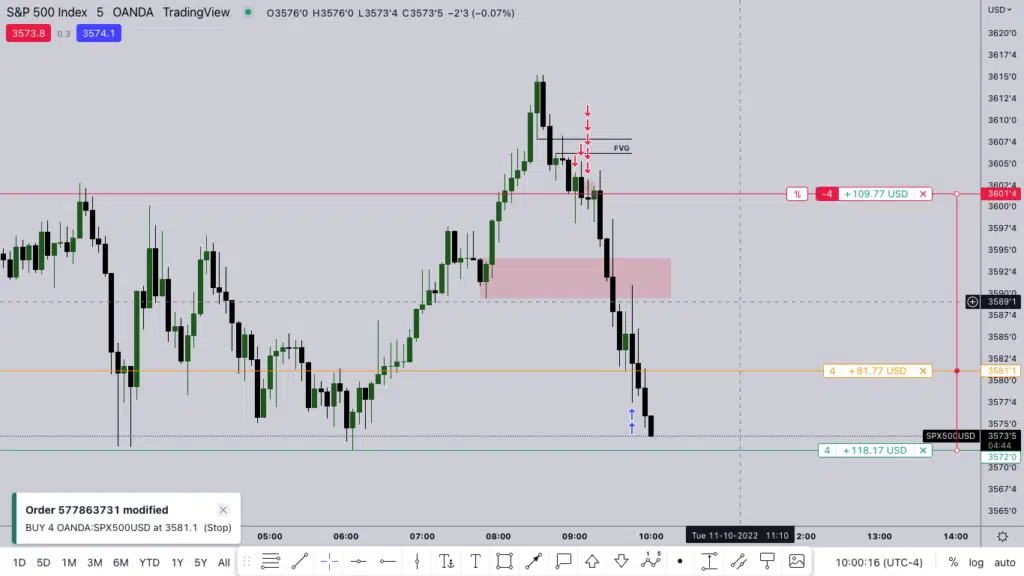
- Fair Value Gaps – Valid order blocks feature “fair value gaps”—price inefficiencies where market makers have deliberately moved price quickly to create imbalances.
- Price Delivery Algorithm – Markets operate on an algorithmic basis that feeds on liquidity. Order blocks represent key reference points in this algorithm.
- Manipulated Price Movement – Large institutions can’t enter their full positions at once. Order blocks show where they’ve begun accumulating or distributing positions before major moves.
Understanding this institutional perspective gives you the context needed to trade order blocks successfully.

How to Identify High-Quality Order Blocks
Not all reversal candles qualify as order blocks. Here’s how to identify legitimate order blocks with a high probability of success:
Key Characteristics of Valid Order Blocks:
- Fair Value Gap Presence – A valid order block must have a fair value gap—a price inefficiency where candles don’t overlap, showing an imbalance.
- Candle Formation – For bearish order blocks, look for the last bullish candle before a strong downward move. For bullish order blocks, find the last bearish candle before a strong upward move.
- Validation Through Price Action – A bullish order block is validated when the high of the lowest down candle is later engulfed by another candle. Similarly, a bearish order block is validated when the low of the highest up candle is later engulfed.
- Clean Liquidity Void – After forming an order block, price should move away decisively, creating a “liquidity void” that will likely be filled later.
- Aligned with Market Structure – The best order blocks align with the overall market structure (bullish or bearish).
Visual Identification Process:
To find bearish order blocks:
- Identify a significant downward move on your chart
- Locate the last bullish candle before this move began
- Confirm that this candle made the highest high before the move
- Verify that a fair value gap exists
To find bullish order blocks:
- Identify a significant upward move on your chart
- Locate the last bearish candle before this move began
- Confirm that this candle made the lowest low before the move
- Verify that a fair value gap exists
Remember: Context matters. An order block without a fair value gap or proper market context is not worth trading.
Order Blocks vs. Supply and Demand: What’s the Difference?
Many traders confuse order blocks with supply and demand zones, but understanding the distinction is crucial:
Order Blocks:
- Represent specific candles where institutional orders are placed
- They are more precise and focused on exact price levels
- Are linked to institutional trading and “smart money” activity
- Require validation through fair value gaps
- Provide more defined entry and exit points
Supply and Demand Zones:
- Represent broader areas where buying and selling pressure shifts
- They are less precise and cover wider price ranges
- Focus on general market psychology rather than specific institutional activity
- Don’t require fair value gaps for validation
- Provide less-defined entry and exit points
While both concepts aim to identify key reversal points, order blocks offer higher precision and a direct connection to institutional trading logic.
The Order Flow Connection: The Missing Key to Success
Understanding order flow is essential for maximizing your success with order blocks. Order flow analysis helps you determine which side of the market is likely to collect liquidity next:
What is Order Flow?
Order flow is a trading concept that focuses on which side of the market price is likely to collect liquidity, either sell-side liquidity (stop losses below previous lows) or buy-side liquidity (stop losses above previous highs).
The Order Flow-Order Block Relationship:
- When order flow is bearish, focus on trading bearish order blocks
- When order flow is bullish, focus on trading bullish order blocks
- Trading against the order flow dramatically reduces your success rate
How to Determine Order Flow:
- Identify market structure (higher highs/lows for bullish; lower highs/lows for bearish)
- Locate liquidity pools (previous significant highs and lows)
- Watch for breaks in market structure that signal potential order flow changes
This understanding allows you to filter out low-probability order blocks and focus only on those aligned with the dominant market flow.
The Complete Trading Strategy: Step-by-Step Approach
Now let’s put everything together into a practical trading strategy:
Trading Bullish Order Blocks:
- Identification
- Find the last bearish candle that creates the lowest low before an upward move
- Confirm the presence of a fair value gap
- Verify alignment with bullish order flow
- Entry Strategy
- Wait for price to move away from the bullish order block, creating a liquidity void
- Enter when price returns to the order block level
- Look for confirmation signals like rejection candlesticks or price action patterns
- Stop Loss Placement
- Set your stop loss just below the low of the bullish order block
- This respects the institutional logic of the setup
- Take Profit Targets
- Target previous swing highs or significant resistance levels
- Consider using a minimum 1:2 risk-to-reward ratio
- Consider scaling out of positions at multiple targets
Trading Bearish Order Blocks:
- Identification
- Find the last bullish candle that creates the highest high before a downward move
- Confirm the presence of a fair value gap
- Verify alignment with bearish order flow
- Entry Strategy
- Wait for price to move away from the bearish order block, creating a liquidity void
- Enter when price returns to the order block level
- Look for confirmation signals like rejection candlesticks or price action patterns
- Stop Loss Placement
- Set your stop loss at least 5 pips above the high of the bearish order block
- This provides a buffer against minor price fluctuations
- Take Profit Targets
- Target previous swing lows or significant support levels
- Consider using a minimum 1:2 risk-to-reward ratio
- Consider scaling out of positions at multiple targets
Advanced Concepts: Propulsion Blocks and Liquidity Voids
To take your order block trading to the next level, master these advanced concepts:
Propulsion Blocks:
A propulsion block is an immediate validation of an order block’s effectiveness:
- Bullish Propulsion Block: A candle that trades down into a bullish order block and then acts as support for higher price movements
- Bearish Propulsion Block: A candle that trades up into a bearish order block and then acts as resistance for lower prices
Propulsion blocks offer:
- Higher probability setups
- Faster confirmation
- Better entry timing
- Improved risk-to-reward ratios
Liquidity Pools and Voids:
Understanding liquidity dynamics enhances your order block trading:
- Liquidity Pools: Areas where stop losses accumulate, usually at previous highs and lows. Price is often drawn to these areas.
- Liquidity Voids: Areas with minimal price action, often created after sharp moves. Price tends to return to fill these voids.
By combining order blocks with liquidity analysis, you can:
- Avoid order blocks near major liquidity pools (which are susceptible to manipulation)
- Focus on order blocks with clean liquidity voids (which price will likely return to fill)
- Time your entries more precisely as price return to fill liquidity voids
Order Blocks That Fail: Warning Signs to Watch
Not every order block leads to a successful trade. Recognize these warning signs of potential failure:
- No Fair Value Gap
- An order block without a fair value gap lacks institutional validation
- These rarely provide reliable trading opportunities
- Against Order Flow
- Order blocks that go against the dominant order flow have a lower probability
- Example: Bullish order blocks in a bearish market structure
- Near Resting Liquidity Pools
- Order blocks close to major liquidity pools (previous highs/lows) are vulnerable to manipulation
- These areas often experience stop runs and fakeouts
- Unclear Market Structure
- Order blocks in choppy, sideways markets lack directional bias
- Wait for a clearer market structure before trading order blocks
- Multiple Conflicting Order Blocks
- When multiple order blocks appear close together, they can counteract each other
- Look for cleaner, more isolated setups
By avoiding these low-probability scenarios, you can dramatically improve your success rate.
Practical Implementation: Building Your Trading Plan
Turn this knowledge into a practical trading plan with these steps:
1. Preparation Phase:
- Set up clean charts with minimal indicators
- Mark significant market structure levels
- Identify the current order flow direction
2. Analysis Phase:
- Scan for potential order blocks with fair value gaps
- Verify alignment with market structure and order flow
- Eliminate low-probability setups
3. Execution Phase:
- Wait for price to create distance from the order block
- Prepare for entry when price returns to test the order block
- Look for confirmation signals before entering
4. Management Phase:
- Set predetermined stop loss and take profit levels
- Consider scaling strategies for larger positions
- Monitor for changes in market structure or order flow
5. Review Phase:
- Document each trade with screenshots and notes
- Analyze what worked and what didn’t
- Continuously refine your approach
Backtesting Your Order Block Strategy
Proper backtesting is essential for building confidence in your order block strategy:
- Define Clear Rules
- What constitutes a valid order block?
- What are your exact entry and exit criteria?
- What risk management parameters will you use?
- Conduct Systematic Testing
- Test across multiple currency pairs
- Include different market conditions (trending, ranging)
- Cover sufficient historical data (minimum 3 months)
- Track Key Metrics
- Win rate (aim for 50%+)
- Average risk-to-reward ratio (aim for 1:2+)
- Maximum drawdown
- Performance in different market conditions
- Refine Your Approach
- Identify patterns in successful vs. unsuccessful trades
- Adjust rules based on statistical evidence
- Continue to test adjustments before implementing
Remember that backtesting is not about achieving perfect results; it’s about building a statistical edge that works over time.