In technical analysis, higher lows and lower highs are powerful indicators that traders use to identify market direction and trend strength. Simply put, higher highs and higher lows signal a bullish trend, meaning prices are moving upward. On the other hand, lower highs and lower lows indicate a bearish trend, showing that prices are moving downward. Recognizing these structures early helps traders align with market momentum and make better entry and exit decisions.
Understanding Higher Highs and Higher Lows (Bullish Structure)
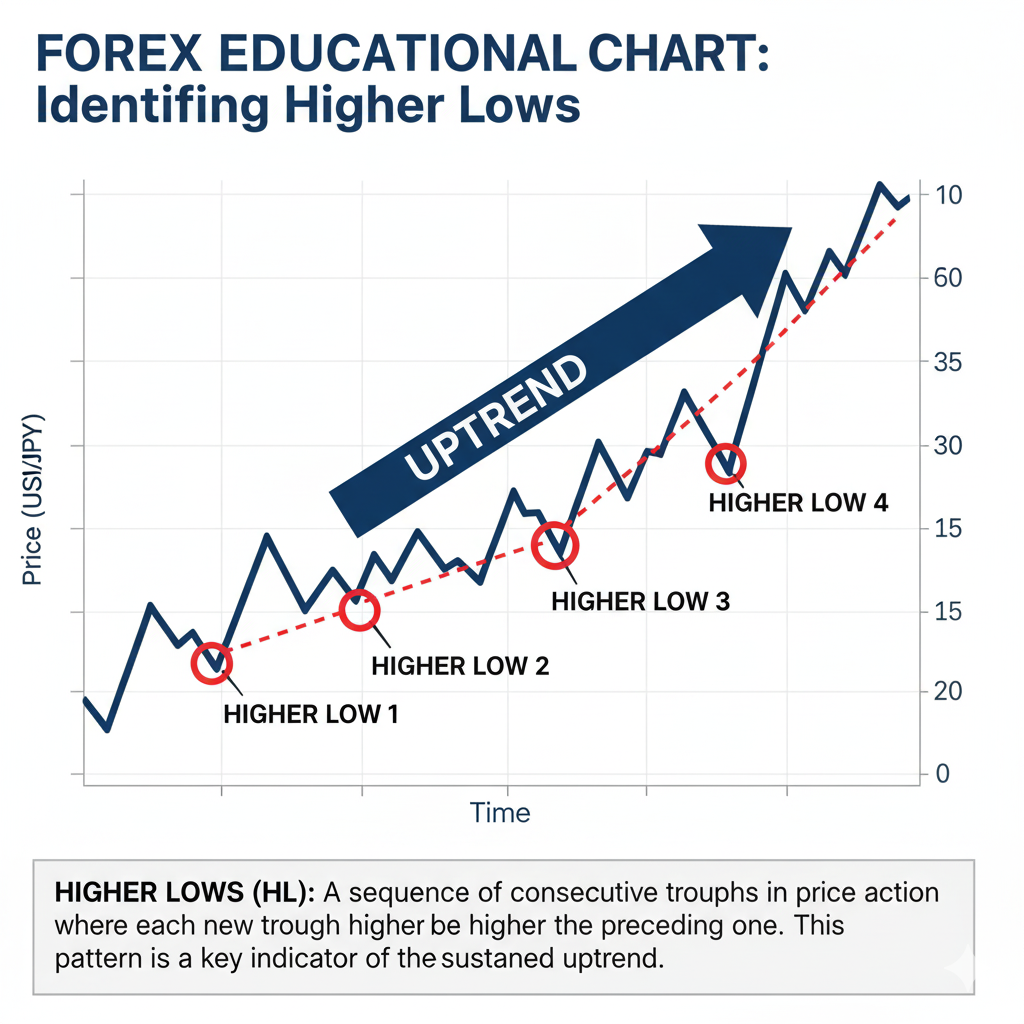
When a market forms a series of higher highs (HH) and higher lows (HL), it means buyers are in control. Each new high breaks above the previous high, and each pullback forms a low that doesn’t drop as far as the last one. This consistent pattern shows strong buying pressure and healthy demand, a sign of an uptrend.
- Higher High (HH): A new peak that forms above the previous high. It confirms that buyers are willing to pay higher prices, pushing the market upward.
- Higher Low (HL): A new low that forms above the previous low. It shows that sellers couldn’t drive the price down as much, meaning buyers are stepping in earlier.
Combined: A sequence of higher highs and higher lows forms an ascending price channel, which reflects a clear and sustained bullish trend.
Understanding Lower Highs and Lower Lows (Bearish Structure)
In contrast, a market forming lower highs (LH) and lower lows (LL) represents a bearish trend, where sellers dominate the market. Each new rally fails to reach the previous high, and each decline breaks below the previous low — signaling strong selling pressure.
- Lower High (LH): A new peak that forms below the previous one. This shows that buyers are losing strength and sellers are pushing the price down from earlier highs.
- Lower Low (LL): A new low that falls below the previous one. It confirms that sellers are firmly in control and that the downtrend remains intact.
Combined: A sequence of lower highs and lower lows forms a descending price structure, often resembling downward “steps,” indicating continuous bearish momentum.

How Traders Use Higher Highs and Lower Lows
- Trend Identification:
Traders rely on these structures to confirm the market’s direction.- A series of higher highs and higher lows = uptrend
- A series of lower highs and lower lows = downtrend
- Entry and Exit Points:
Price action traders often use higher lows as potential buy zones during uptrends, and lower highs as potential sell zones during downtrends. These areas provide natural points for entries, stop-loss placement, and profit-taking. - Reversal Signals:
When market structure shifts, for example, from lower lows/lower highs to higher lows/higher highs, it may signal a trend reversal. Recognizing this early can give traders a head start on a new move. - Risk Management:
By tracking market structure, traders can set logical stop-losses below the last higher low in an uptrend or above the last lower high in a downtrend, keeping risk controlled.
Understanding higher highs and higher lows versus lower highs and lower lows is one of the simplest yet most effective tools in price action trading. It helps traders stay aligned with the market flow rather than guessing tops or bottoms. Whether you’re trading forex, crypto, or indices, learning to read market structure gives you a major edge in identifying trend continuation and potential reversals.