INTRODUCTION:
A liquidity sweep is one of the most important concepts in smart money trading. Once you understand it, you start seeing the market completely differently. What looks like a breakout to most retail traders is actually institutions doing exactly what they need to do before reversing price.
This article breaks down what a liquidity sweep is, why it happens, how to spot it on your chart, and how to trade it using the GhostTraders methodology.
What Is a Liquidity Sweep
A liquidity sweep happens when price moves into an area with a large number of stop losses, triggers those stops, collects the liquidity, and then reverses sharply in the opposite direction.
Institutions cannot fill large orders in thin markets. They need liquidity to execute. The most reliable source of liquidity in the market is retail traders’ stop losses sitting just above swing highs and just below swing lows. When institutions need to fill a large buy order, they push price down below the recent low, trigger all the sell stops sitting there, and use that activity to fill their position. Once filled, price reverses upward and the retail traders who got stopped out watch the market go in the direction they originally anticipated.
This is not manipulation for the sake of it. It is how large orders get filled. Understanding this changes how you read every single candle on your chart.
Buy Side Liquidity Sweep vs Sell Side Liquidity Sweep
There are two types of liquidity sweeps, and you need to know both.
Buy Side Liquidity Sweep (BSL Sweep)
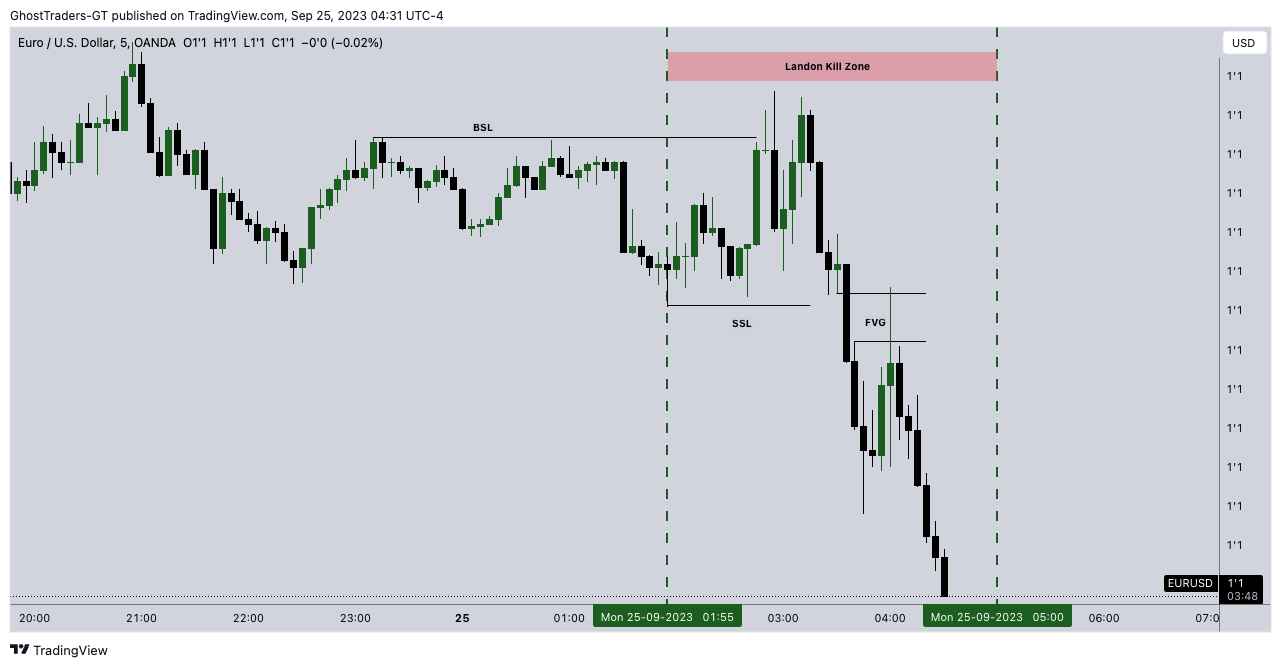
Buy-side liquidity sits above swing highs, equal highs, and previous day or week highs. When price sweeps above these levels and then reverses back down, that is a buy-side liquidity sweep. Smart money pushed price up to trigger the buy stops and breakout orders sitting above those highs, collected that liquidity, and then used it to sell into the market. The result is a reversal to the downside.
Sell Side Liquidity Sweep (SSL Sweep)
Sell-side liquidity sits below swing lows, equal lows, and previous day or week lows. When price sweeps below these levels and then reverses back up, that is a sell-side liquidity sweep. Smart money pushed price down to trigger the sell stops and short positions sitting below those lows, collected that liquidity, and then used it to buy into the market. The result is a reversal to the upside.
Where Liquidity Pools Sit on Your Chart
Before you can spot a sweep, you need to know where to look.
Liquidity pools form wherever retail traders cluster their stop losses. The most common locations are:
Previous day highs and lows. These are the levels most traders mark on their charts and place stops beyond. They are almost always swept before price commits to a direction.
Equal highs and equal lows. When price touches a level twice or more without breaking through, a large pool of stops builds up on the other side. These are prime sweep targets.
Asian session highs and lows. During the London and New York kill zones, price frequently sweeps above or below the Asian range before reversing. This is one of the cleanest setups in the model.
Weekly highs and lows. Higher timeframe liquidity pools attract larger institutional orders and produce bigger reversals when swept.
How to Identify a Liquidity Sweep
Spotting a liquidity sweep in real time takes practice but the pattern is consistent. Here is what to look for:
Price approaches a clear swing high or swing low that has been respected multiple times. This is where the liquidity pool is building.
Price briefly breaks above the high or below the low. Not by much, sometimes just a few pips, but enough to trigger the stops sitting there.
The candle that swept the level closes back on the other side of it. This is the key signal. A wick through the level that closes back in the range is a strong indicator of a sweep rather than a genuine breakout.
Price then shows a change of character. After the sweep, watch for a market structure break in the opposite direction. The shift in structure confirms that the sweep is done and the real move is beginning.
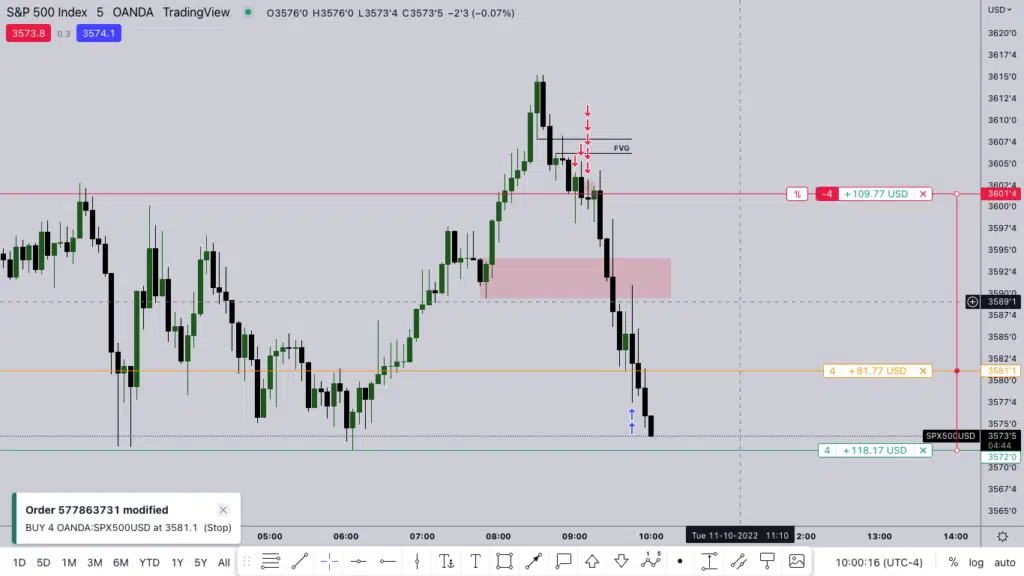
You enter on the fair value gap created during the move away from the swept level, not on the sweep itself.
How to Trade a Liquidity Sweep (Step by Step)
Before the Kill Zone (Setup Phase)
Mark the previous day high and low on your chart. Mark the Asian session high and low. Identify any equal highs or equal lows that have built up. These are your liquidity targets for the session.
Identify the daily bias. Are you looking for buy setups or sell setups today? The bias tells you which type of sweep to look for. If the bias is bullish, you are watching for a sell side liquidity sweep that gives you a buy entry. If the bias is bearish, you are watching for a buy side liquidity sweep that gives you a sell entry.
During the Kill Zone (Execution Phase)
Wait for price to push into the liquidity pool you identified. Do not enter on the way into the sweep. Let the sweep happen.
Watch for the candle to close back on the near side of the swept level. That is your signal the sweep is complete.
Wait for a break in market structure in the direction of your bias. This confirms the reversal is real.
Enter on the first fair value gap that forms during the structural break away from the sweep. Set your stop loss just beyond the swept level. Your take profit target is the nearest opposing liquidity pool.
Liquidity Sweep Checklist
Use this before every trade you base on a liquidity sweep.
Before 07:00 AM NYT UTC-5, identify and mark buy side and sell side liquidity on your chart
Confirm your daily bias so you know which direction the sweep should set up
Wait for price to reach and briefly breach the liquidity pool
Confirm the sweeping candle closes back inside the range, not through it
Wait for a market structure break in the direction of your bias
Look for a fair value gap in the move away from the swept level
Enter at the fair value gap retracement with stop beyond the swept level
Take profit at the nearest opposing liquidity pool before 10:00 AM NYT UTC-5
Liquidity Sweep vs Breakout
One of the most common mistakes traders make is confusing a liquidity sweep with a genuine breakout. The difference matters because the trade you take is completely opposite.
A liquidity sweep closes back inside the range. The candle wicks through the level and closes on the other side. Volume spikes on the sweep candle and then drops off. Price shows a structure break in the opposite direction shortly after.
A genuine breakout closes and holds outside the level. Follow-through candles continue in the same direction. There is no sharp reversal immediately after the break.
When in doubt, wait for the close. If the candle that breached the level closes back inside, treat it as a sweep and look for the reversal. If it closes outside and the next candle continues in the same direction, it is a breakout and the setup is not there.

When to Avoid Trading Liquidity Sweeps
Not every sweep produces a clean trade. Skip the setup when:
A major news event is scheduled within an hour of the sweep. News can extend the sweep or create a false reversal.
The sweep happens outside the kill zone window. Sweeps during low-volume hours are unreliable and often do not produce the structure break you need.
There is no fair value gap after the structure break. The FVG is your entry. Without it, you are guessing on entry and your risk management falls apart.
The daily bias is unclear. If you cannot identify whether the day should be bullish or bearish, you do not know which type of sweep to trade.
Summary
A liquidity sweep is not something to fear. It is information. When you see price spike above a swing high or below a swing low and immediately reverse, that is institutions at work. They needed the liquidity sitting at that level to fill their orders, and now that they are positioned, price moves in their direction.
Your job is to wait for the sweep, confirm the reversal with a structure break, and enter on the fair value gap. That is the model. Apply it consistently during the London and New York kill zones, and it becomes one of the most reliable setups in smart money trading.