Fair Value Gaps (FVGs) and Liquidity Voids are both terms used in technical analysis to describe areas of price imbalance in the market, but they refer to slightly different concepts. Here’s a comparison between the two:
Fair Value Gap (FVG):
- Definition: A Fair Value Gap is an imbalance in price action where a portion of the price range did not trade due to an aggressive movement in one direction. It typically forms in a three-candlestick pattern when price moves so quickly that a gap is left between the first and third candles (ignoring the middle candle). This suggests that price has moved too far, too fast, and that there may be unfilled orders in that gap.
- Characteristics:
- It often appears after a sharp move in the market.
- Traders expect the price to “fill” this gap, returning to this area of imbalance before resuming its original trend.
- FVGs are seen as potential areas where liquidity might be resting, and where price could retrace before continuing in the same direction.
- Example: In a strong bullish move, if a gap forms between the high of the first candle and the low of the third candle, traders may expect the market to return to this gap before continuing upward.
Liquidity Void:
- Definition: A Liquidity Void refers to a larger area on the chart where price moves very quickly with little to no consolidation or interaction between buyers and sellers. This typically happens in a volatile market move or after major news events, where price “skips” over certain levels without filling the usual order flow.
- Characteristics:
- A Liquidity Void represents a complete absence of price action between certain levels, typically seen in large, fast market moves.
- These areas are considered “inefficient” because the price didn’t spend enough time there to establish proper market structure or volume.
- Liquidity Voids are often much larger than FVGs, spanning entire segments of price action, and tend to be filled over time as the market moves back through them.
- Example: If there’s a large price gap (say, after a market-moving announcement), the market can move several points without forming any meaningful candles or consolidation. This creates a “void” in liquidity, where there are few to no trades executed.
Key Differences:
- Size and Scope:
- FVG: A Fair Value Gap is typically smaller, occurring in a specific three-candlestick pattern where there’s a noticeable imbalance between price highs and lows over a short time.
- Liquidity Void: A Liquidity Void spans a larger area and represents a region where price moved too quickly to form any meaningful structure, often leaving a large space on the chart.
- How They Form:
- FVG: Caused by imbalances during price moves, particularly when institutions or large orders push the market quickly in one direction, leaving a gap.
- Liquidity Void: Caused by extreme market conditions, such as high volatility, economic news, or significant institutional moves, where price bypasses large sections without significant trade volume.
- Market Behavior:
- FVG: It’s expected that the price will return to this smaller gap to “fill” it, as the market seeks to balance the unfilled orders left in that area.
- Liquidity Void: These are often seen as highly inefficient areas of price action and are likely to be filled over time, as the market rebalances liquidity across a wider price range.
- Usage in Trading:
- FVG: Traders use FVGs to find potential retracement levels in the price where unfilled orders may still exist. These gaps are seen as high-probability areas for price to revisit before continuing its trend.
- Liquidity Void: A Liquidity Void is more significant and may signal a deeper retracement or corrective move. Price is expected to revisit these large voids to establish liquidity and fill in the skipped levels over time.
Practical Application:
- FVG: A trader might look for an entry when price retraces into an FVG area, expecting it to act as a support or resistance zone where liquidity may be captured.
- Liquidity Void: Traders may expect the price to revisit and “fill” the void, with the idea that large price gaps often get corrected as the market seeks equilibrium.
N.B: Liquidity voids highlight inefficiencies in price action, while fair value gaps present opportunities for entries as the price retraces to fill these inefficiencies.
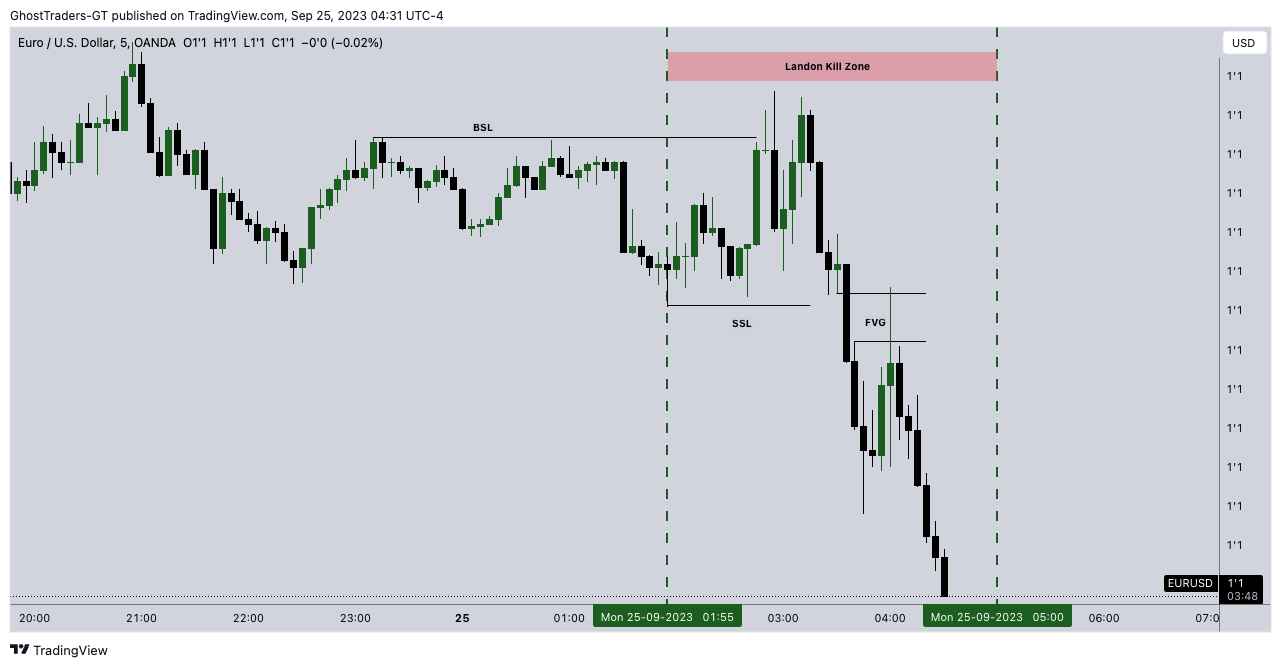
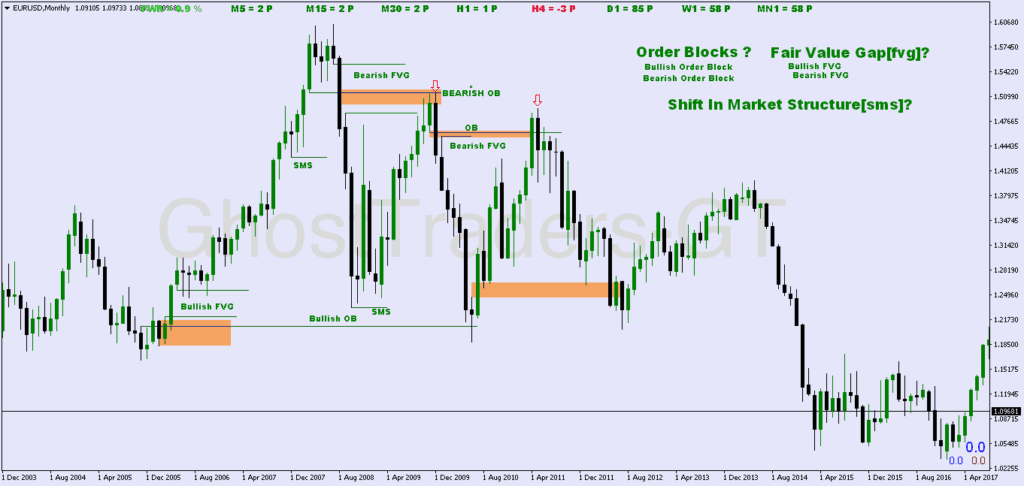
Fair value gaps vs Liquidity voids Visual Example:
- FVG: A small gap between the highs and lows of candles where price didn’t trade.
- Liquidity Void: A large, clean movement (like a gap or fast move) over several price levels without any consolidation or smaller candles in between.
From the above charts, you can see that liquidity voids and fair value gaps are always present at the same time in every chart. Because Liquidity voids indicate inefficiencies in price movement, fair value gaps are used for entries when the price retraces to close these inefficiencies (liquidity voids).
Fair value gaps vs Liquidity voids Summary:
- Fair Value Gaps (FVGs): These are small, specific price gaps in a three-candlestick formation that represent a minor imbalance. Traders expect price to revisit this gap to “fill” it.
- Liquidity Void: A large price gap or swift price movement where there’s little trading activity or consolidation, typically left by significant market events. These voids are expected to be revisited over time to reestablish liquidity.
Both concepts deal with imbalances in the market, but the FVG is a smaller, more frequent occurrence, while Liquidity Voids are larger, less common, and more structurally significant.


