Last updated on February 17th, 2025 at 12:56 pm
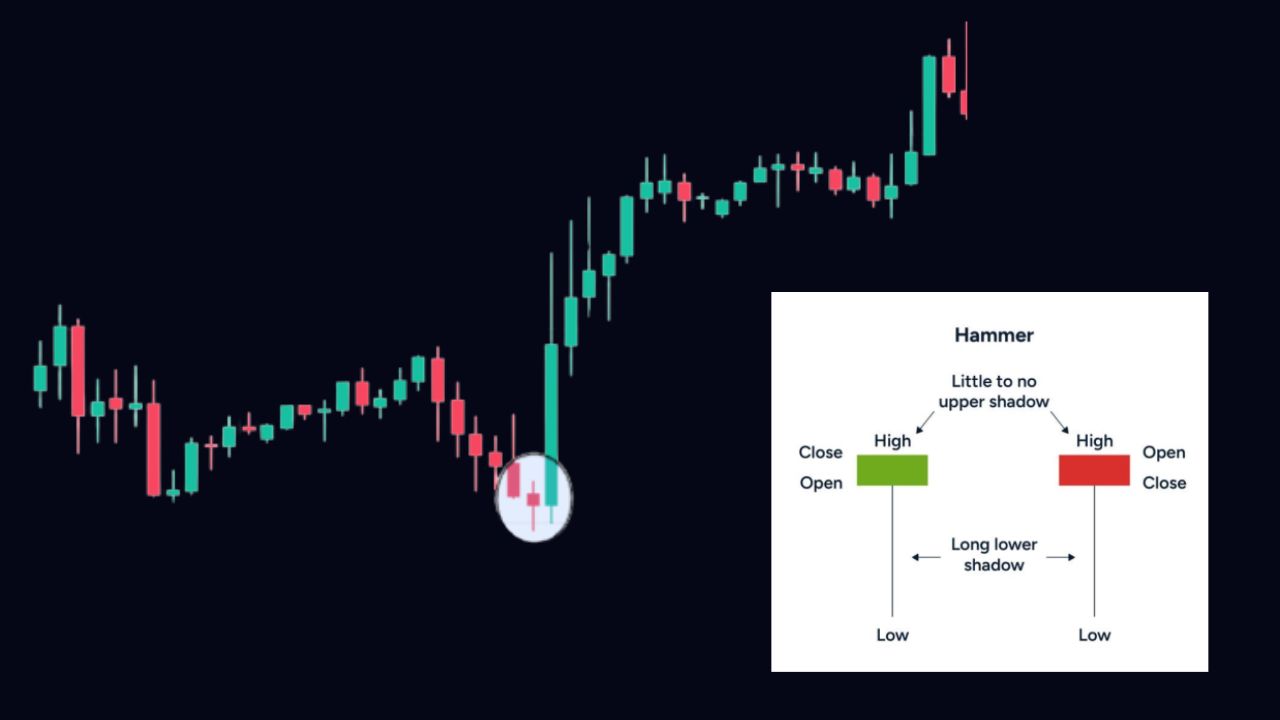
hammer candlesticks stand out as a beacon of potential reversal. Imagine a scenario where a security’s price has been on a downward spiral, but then, within the same trading period, it drops significantly from the opening only to rally back, closing near where it started. This creates a visual akin to a hammer, with a small real body and a long lower shadow, at least twice the length of the body itself.
Hammer Candlestick Key Takeaways:
- Appearance: A hammer candlestick features after a price drop with a small real body (the difference between open and close) and a long lower shadow, suggesting a rejection of lower prices.
- Market Dynamics: It forms when sellers initially drive the price down, but buyers step in, pushing the price back up to near the opening level.
- Confirmation: For a hammer to signal a bullish reversal, the next candle should close above the hammer’s close, showing sustained buying interest.
- Structure: The hammer’s body can close slightly above or below the open, but it must be small. The lower shadow should be substantial, symbolizing the rejection of lower price levels.
Understanding Hammer Candlesticks:
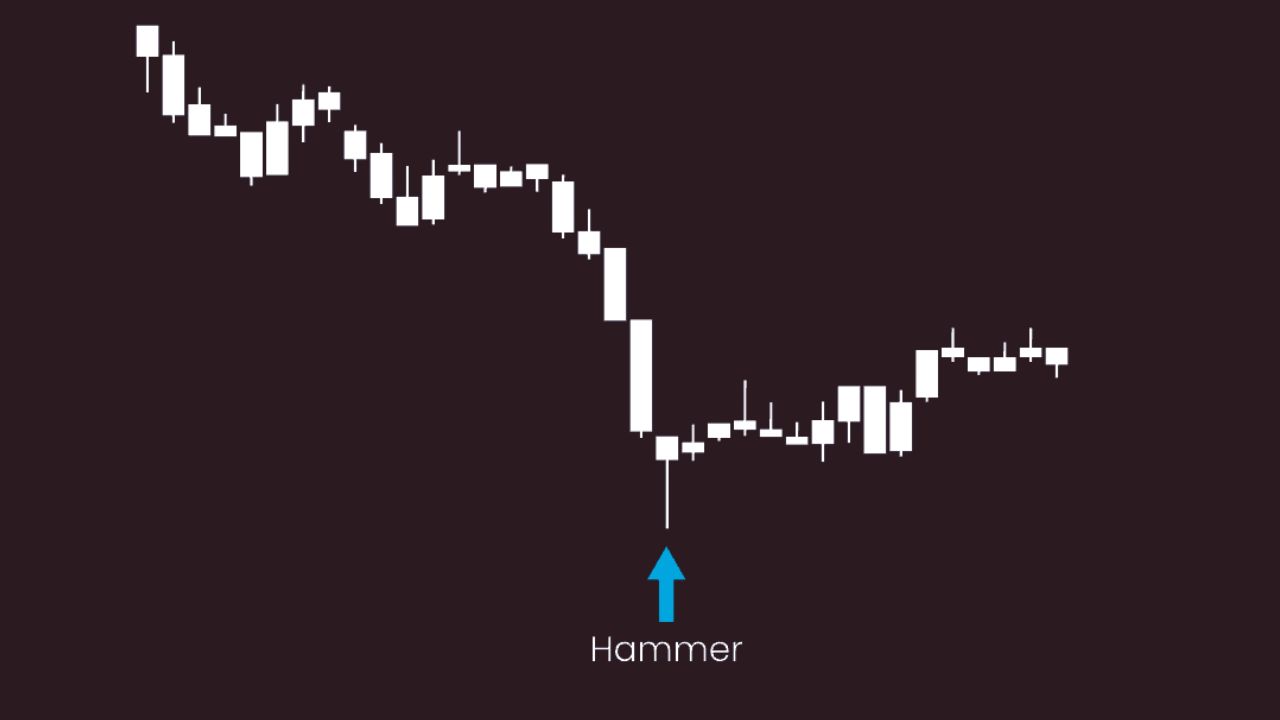
Hammers are particularly significant after a price decline, hinting at market capitulation where sellers give up, and buyers take control, potentially marking the bottom of a trend. Here’s what you need to know:
- Visual Cue: A hammer should resemble a “T” with a pronounced lower shadow, indicating a strong fightback from the lower price levels achieved during the session.
- Confirmation: The bullish signal is only confirmed if followed by a candle closing higher than the hammer’s close.
The Difference Between a Hammer and a Doji:
While both hammer and doji have small real bodies, their implications differ:
- Doji: Represents indecision with both upper and lower shadows, potentially signaling a reversal or continuation based on subsequent price action.
- Hammer: Specifically signals a potential upside reversal following a downtrend, with its long lower shadow as the key feature.
Limitations of Using Hammer Candlesticks:
- No Guaranteed Continuation: Even with a confirmed hammer, there’s no assurance of an upward trend continuation.
- Risk Management: A stop loss far from the entry might not be optimal, given the potential for false signals.
- Lack of Price Targets: Hammers don’t specify how far the price might rise, making it challenging to set profit targets.
Psychology of the Hammer Candlesticks Patterns:
The hammer pattern reflects a shift in market sentiment from bearish to bullish within a single trading period. The long shadow shows sellers’ attempts to push the price down, countered by buyers’ resilience, closing the session near the opening price, and suggesting a potential turnaround.
Practical Application:
- Identification: Spot a hammer in a downtrend with its characteristic small body and long lower shadow.
- Confirmation: Look for the next candle to close above the hammer for validation.
- Trade Entry: Enter long positions or exit shorts during or after confirmation, with a stop loss below the hammer’s low.
- Exiting Trades: Determine exits based on additional analysis or resistance levels since the hammer itself doesn’t provide price targets.
By By understanding and applying the hammer candlestick pattern correctly, traders can enhance their ability to spot potential trend reversals and make informed trading decisions.
Additional Considerations
These concepts have their limitations; hence, I would advise considering smart money trading concepts, as they are superior and have a higher win probability rate in trading. However, for those who are proficient in candlestick pattern trading, there is no need to worry—continue using it as your trading strategy.