Last updated on February 17th, 2025 at 12:47 pm
Doji candles are among the most significant candlestick patterns in technical analysis. They represent market indecision and can signal potential trend reversals or continuations. Traders closely watch doji formations, as they often provide critical insights into price action, helping to refine entry and exit strategies. Here’s a brief breakdown of its components:
- Body: Very small or nonexistent, showing little to no price movement between open and close.
- Wicks (Shadows): Long wicks can extend from either end or both, representing the range of price action during the session.
Understanding Doji Candles
A doji candle forms when the opening and closing prices of an asset are nearly equal, resulting in a small or non-existent body. This pattern reflects a tug-of-war between buyers and sellers, with neither side gaining a decisive advantage. While a single doji may not provide a clear signal, its significance increases when analyzed in the context of support and resistance levels, prevailing trends, and other technical indicators.
Why Are Doji Candles Important?
1. Confirming or Negating Trend Reversals
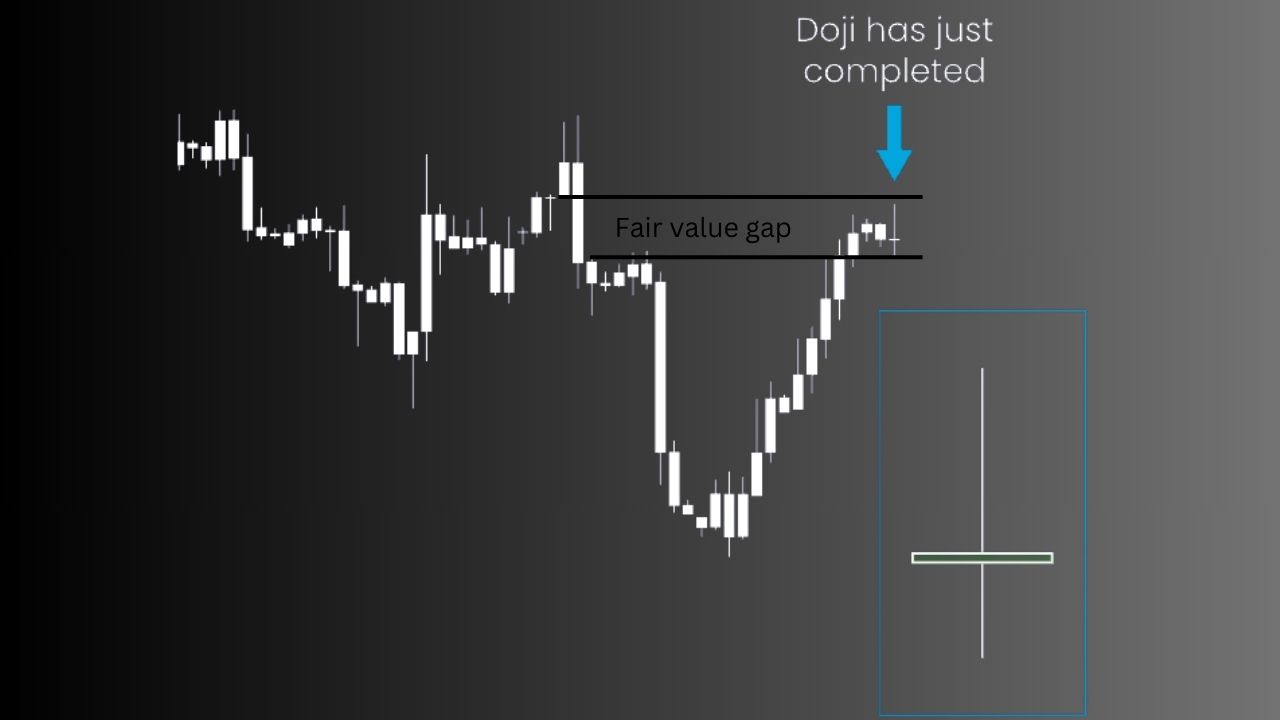
A completed doji can help traders confirm or reject the possibility of a significant high or low. If a doji appears at the peak of an uptrend or the trough of a downtrend, it may indicate an impending reversal.
2. Leading Indicator for Price Swings
Doji candles often act as leading indicators, suggesting a short-term price swing or trend reversal. Traders who recognize this pattern can prepare for potential market shifts and adjust their trading strategies accordingly.
3. Strengthening Other Reversal Indicators
When a doji appears at key support or resistance levels, especially after a long trend or a wide-ranging candlestick, it strengthens other reversal indicators. This added confirmation increases the likelihood of a trend change.
Types of Doji Candles and Their Significance
There are several types of doji candles, each with its implications for price action. Understanding these variations can help traders interpret market sentiment more effectively.
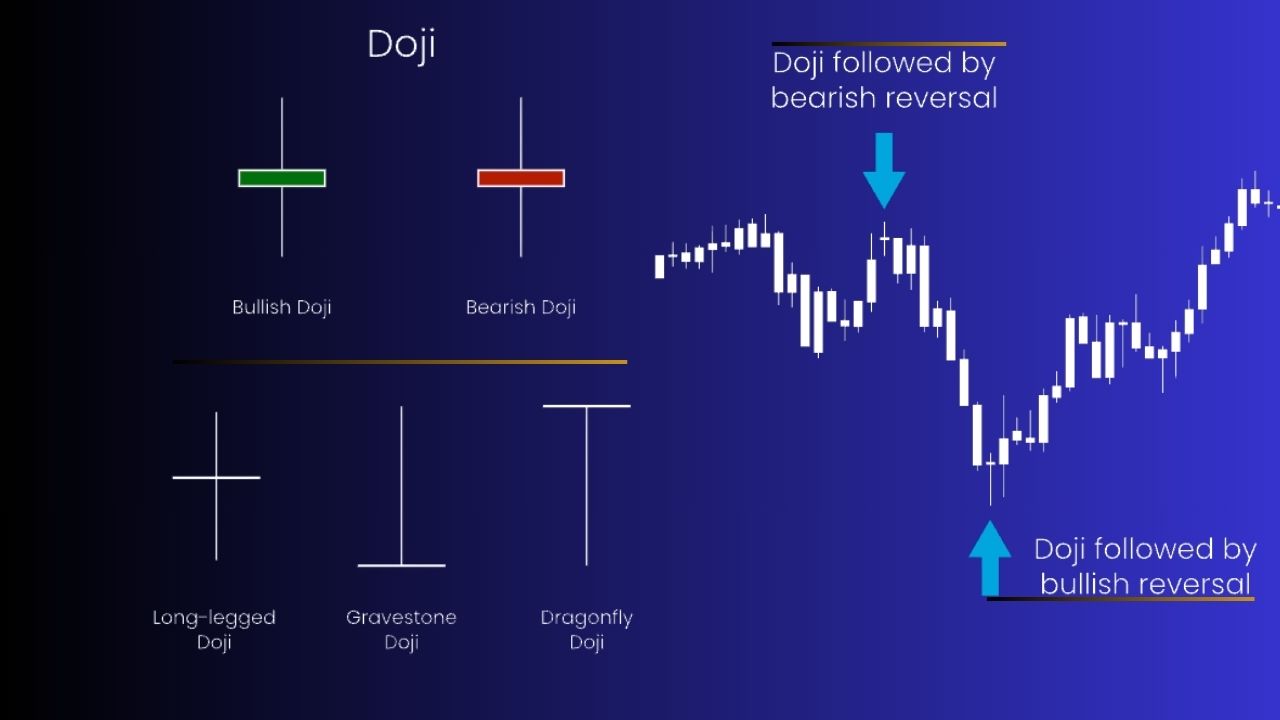
1. Long-Legged Doji
A long-legged doji has extended upper and lower shadows, indicating a significant level of indecision. Neither buyers nor sellers establish control, and the market remains uncertain. This type of Doji is more relevant when found at critical price levels.
2. Gravestone Doji
A gravestone doji forms when prices open near the low, rally during the session, but close back near the opening level. This suggests that buyers initially had control but were overpowered by sellers by the session’s end. It is often seen as a bearish reversal signal, especially when it appears after an uptrend.
3. Dragonfly Doji
A dragonfly doji is the opposite of the gravestone doji. It forms when prices open near the high, decline during the session, but then recover to close near the opening price. This suggests that sellers initially pushed prices lower, but buyers regained control. It is typically seen as a bullish reversal signal, especially after a downtrend.
4. Failed Doji
A failed Doji occurs when the market fails to reverse after the appearance of a doji. Instead of signaling a reversal, it leads to a continuation of the current trend. This suggests that the existing momentum remains intact, and traders should be cautious about prematurely anticipating a reversal.

Interpreting Doji Candles
Dojis are often harbingers of potential trend reversals or continuations, but their interpretation largely depends on context:
- After an Uptrend, a doji might suggest that buying pressure is waning, potentially leading to a bearish reversal. In this scenario, a gravestone doji is particularly ominous.
- After a Downtrend: Here, a Doji can signal that selling pressure is diminishing, hinting at a possible bullish reversal. A Dragonfly Doji would be a strong indication of this.
- Within a Range or Consolidation: Dojis can show that the market is undecided, which might either continue the current trend or indicate a breakout soon.
Practical Tips for Trading with Doji Candles
- Time Frame: Dojis on longer time frames (daily, weekly) tend to provide more reliable signals than those on shorter time frames (minute charts).
- Market Context: Always consider the broader market environment, including economic indicators, news, and market sentiment, which can influence the effectiveness of Doji signals.
- Patience: Dojis often signal potential changes, but these changes might take time to materialize. Patience in waiting for confirmation can be the key to successful trading.
Conclusion
The Doji candle is a powerful indicator of market indecision, offering insights into potential shifts in market direction. By understanding the various types of Doji and integrating them with a comprehensive trading plan, traders can enhance their ability to read and react to market conditions. However, like all trading tools, the Doji should not be used in isolation but as part of a broader analytical framework, ensuring that decisions are well-informed and aligned with overall market trends and personal risk tolerance.