Last updated on April 6th, 2026 at 04:43 am
Order flow trading is a market analysis approach that identifies the directional bias of the market by tracking where large buy and sell orders are being placed and executed. Price does not move randomly. Every move in the market is the result of institutional players hunting liquidity, executing large orders, and manipulating price toward areas where retail traders have placed their stops and pending orders.
In institutional order flow trading, the focus is on three key questions:
Where is smart money positioned? Institutions accumulate positions in specific zones before making their real move. Identifying these zones gives you the entry edge.
Where is the liquidity? Previous highs and lows are magnets for institutional activity because that is where retail stop-losses and pending orders sit. Price moves toward liquidity, not away from it.
What is the directional bias? Once you know which direction smart money is pushing price, every trade you take is aligned with the dominant order flow rather than fighting it.
This approach is the foundation of Smart Money Concepts (SMC) and is distinct from footprint-chart-based order flow analysis. GhostTraders’ methodology uses price action, liquidity zones, order blocks, and fair value gaps to read institutional intent directly from the chart, without the need for specialized software.
Why Institutional Order Flow Moves Price
Most retail traders focus on price. Institutional traders focus on liquidity. This is the fundamental difference between how smart money operates and how retail traders think.
Large institutions cannot simply place a single market order to enter a position. A buy order of that size would move the market against them before they are even filled. Instead, they engineer price to reach zones where they can absorb the liquidity they need with minimal slippage. This engineering is what creates the price movements retail traders see on their charts every day.
The mechanism works like this. Institutions identify areas where large volumes of retail orders are resting, typically around obvious support and resistance levels, previous highs and lows, and round numbers. They then drive price into those areas to trigger those orders. The triggered stop-losses become the liquidity that institutions use to fill their positions. Once filled, they reverse price in the direction they originally intended.
This is not manipulation in the illegal sense. It is simply how large players operate in a market where they need enormous liquidity to execute. Understanding this dynamic allows retail traders to stop being the liquidity and start following the trail that institutions leave behind.
The Three Phases(Powe of ThreePO3) of Institutional Order Flow
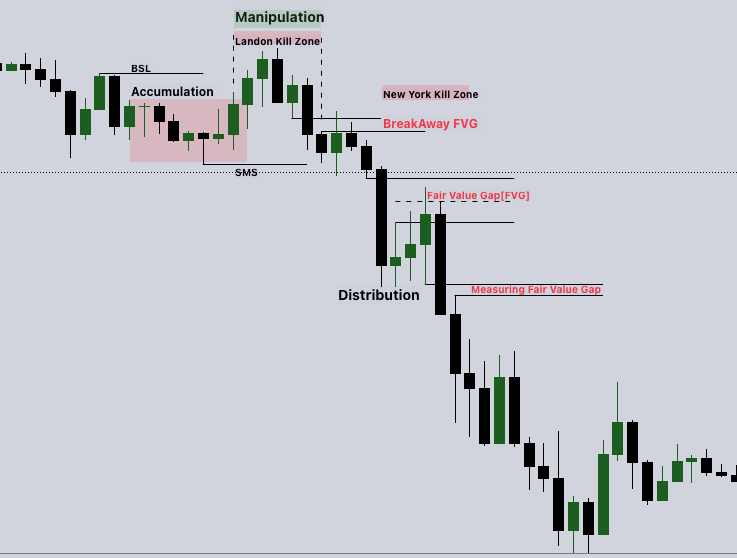
Institutional order flow moves through three distinct phases: accumulation, manipulation, and distribution. This cycle, known as the Power of Three (PO3), repeats across all timeframes and all markets.
Accumulation
During accumulation, institutions build their positions quietly within a narrow price range. This phase often appears as consolidation on the chart, which lulls retail traders into thinking the market is ranging with no clear direction. What is actually happening is that smart money is loading up on positions before making a significant move.
Accumulation phases are characterized by tight price action, reduced volatility, and no clear trend. Retail traders typically avoid these periods, which is exactly when institutions are most active.
Manipulation
The manipulation phase is where institutions drive price toward a liquidity pool, usually against the direction of the eventual move. In a bullish scenario, price dips below a previous low to sweep sell-side liquidity before reversing upward. In a bearish scenario, price pushes above a previous high to sweep buy-side liquidity before reversing downward.
This phase is what traps retail traders. They see price break a key level and jump in, expecting continuation, only to watch it reverse immediately. That reversal is the real move. The manipulation was designed to collect the liquidity those traders provided.
Distribution
Once institutions have accumulated enough liquidity through the manipulation phase, they distribute their positions, causing price to move decisively in the intended direction. This is the phase where the real trend emerges and where order flow traders want to be positioned.
Understanding these three phases allows traders to stop reacting to price and start anticipating institutional intent. The question is no longer “where is price going?” but “which liquidity pool is price targeting next?”

How to Identify Institutional Order Flow on Your Chart
Reading institutional order flow does not require specialized software. The footprints of smart money are visible on any standard price chart if you know what to look for.
Step 1: Establish Your Directional Bias on the Daily Timeframe
Always start with the daily timeframe. The daily order flow gives you the broadest view of where institutions are positioning. Ask yourself: is price making higher highs and higher lows (bullish order flow), or lower highs and lower lows (bearish order flow)? If the daily is unclear, drop to the H4 and then the H1 for a more granular view. Weekly and monthly order flow should also be checked periodically, as the higher timeframe always influences the lower timeframe.
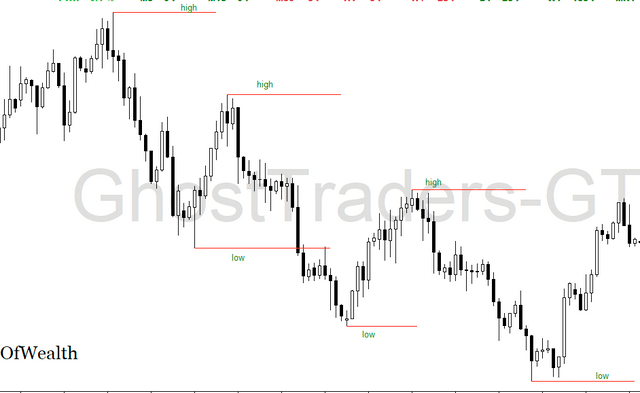
Step 2: Identify the Nearest Liquidity Pools
Mark the most recent significant highs and lows on your chart. These are the primary liquidity pools that institutions will target. Buy-side liquidity (BSL) sits above previous highs in the form of buy stops and breakout orders. Sell-side liquidity (SSL) sits below previous lows in the form of sell stops and breakdown orders. Price will gravitate toward whichever pool aligns with the current institutional bias.
Step 3: Watch for the Liquidity Sweep
Once you have identified the target liquidity pool, wait for price to move into it and sweep it. A liquidity sweep is characterized by price briefly breaking through the high or low, triggering the resting orders at that level, and then reversing sharply. This reversal is your signal that the manipulation phase is complete and the distribution phase is beginning.
Step 4: Confirm with a Shift in Market Structure
After the liquidity sweep, look for a change of character (ChoCH) or a market structure shift on a lower timeframe. This confirms that smart money has reversed direction and the new move is underway. Do not enter before this confirmation. The shift in structure is what separates a real reversal from a continuation.
Step 5: Enter Using Order Blocks and Fair Value Gaps
Once market structure has shifted, look for the nearest order block or fair value gap in the direction of the new move. These are your precise entry zones. In a bullish setup, price will often retrace to a bullish order block or fill a bullish fair value gap before continuing upward. In a bearish setup, price retraces to a bearish order block or bearish fair value gap before pushing lower.
Bearish vs Bullish Institutional Order Flow
Bearish Institutional Order Flow
A bearish institutional order flow anticipates price seeking sell-side liquidity. In this scenario, the market is targeting previous lows where retail stop-losses and sell orders are resting. Trading setups using bearish order blocks and bearish fair value gaps are most effective in this environment. Bullish order blocks are more prone to failure during bearish order flow because the dominant institutional pressure is to the downside. When the market structure is bearish, focus exclusively on bearish setups and avoid fighting the institutional direction.
Bullish Institutional Order Flow
A bullish institutional order flow expects price to pursue buy-side liquidity, targeting previous highs where retail buy stops and breakout orders sit. Bullish order blocks and bullish fair value gaps become the primary entry tools. Bearish order blocks are prone to failure in a bullish order flow environment. When the market structure is bullish, concentrate on bullish setups and align every trade with the upward institutional momentum.
Liquidity Pools: The Engine Behind Order Flow
Institutional order flow revolves around liquidity pools, the areas of resting orders that smart money is drawn to. These pools sit at key technical levels: previous highs and lows, obvious support and resistance, and round-number price levels. They exist because retail traders cluster their stops and pending orders at the same obvious places.
For institutions, these liquidity pools serve a critical purpose. They provide the volume needed to fill large orders without causing excessive slippage. By driving price into these zones, institutions can complete their order execution and simultaneously trap retail traders on the wrong side of the market.
Retail traders can use liquidity pools strategically by anticipating which pool will be targeted next based on the current order flow direction. When price approaches a liquidity pool from a direction consistent with the institutional bias, the probability of a sweep and reversal is high. Position yourself on the right side of that sweep, and you are trading alongside smart money rather than against it.
Key Order Flow Concepts Every Trader Must Know
Institutional Order Flow Entry Drill (IOFED)
IOFED occurs when price retraces into a Fair Value Gap but reverses before reaching the 50% midpoint. This happens when institutional order flow is so dominant that the market does not need to fill the gap completely before continuing the original move. IOFED entries are earlier and often cleaner than waiting for full gap fills, but they require strong directional conviction and a clear order flow bias to execute confidently.
Consequent Encroachment (CE)
Consequent Encroachment is when price fills exactly 50% of a Fair Value Gap, reaching the mean threshold of the gap. This is the more conservative entry compared to IOFED. Because price might not fill the entire FVG, targeting the 50% level is the practical approach that avoids missing trades when institutional order flow pushes back before the gap is fully closed.
Fair Value Gaps as Order Flow Confirmation
Fair Value Gaps are not just entry tools. They are confirmation of institutional order flow direction. A bearish fair value gap signals dominant bearish order flow. A bullish fair value gap signals dominant bullish order flow. When you identify the order flow direction first and then use fair value gaps to time your entries, you are combining two of the most powerful concepts in smart money trading.
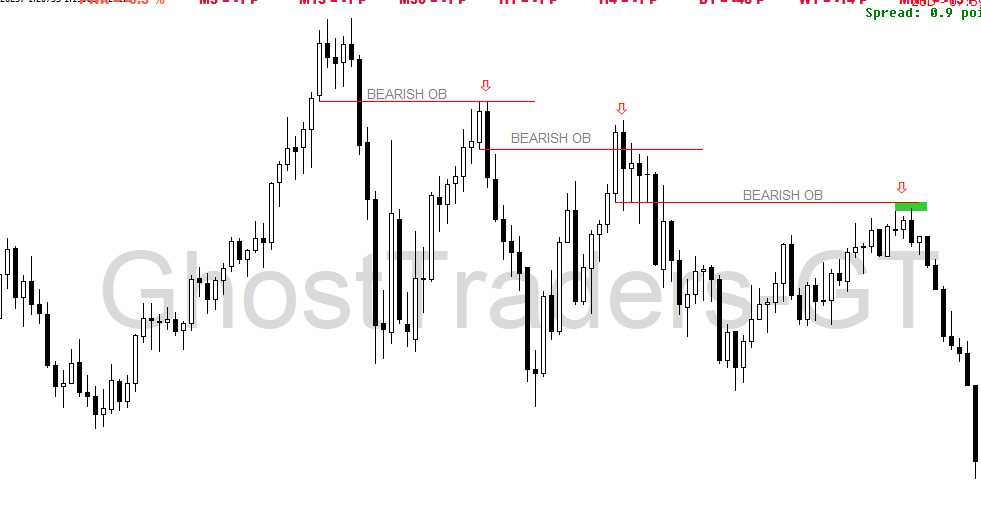
Order Blocks as Institutional Footprints
An order block represents the last up or last down candle before a significant price move, validated by the presence of a fair value gap. Order blocks mark the zones where institutions placed their large orders. An order block without a fair value gap is more likely to fail and should be approached with caution. When an order block and a fair value gap align at the same level, the probability of a reaction is significantly higher.
Timeframe Guidance for Order Flow Trading
Reading order flow across multiple timeframes is essential for precision.
The monthly and weekly timeframes reveal the macro institutional bias. These are checked periodically to understand the broader directional intent of smart money. They will always influence what happens on smaller timeframes.
The daily timeframe is the primary reference for most traders. Daily order flow establishes the bias that governs your trading decisions for the week. If the daily order flow is bearish, all setups should be bearish.
The H4 and H1 timeframes are used for refinement when the daily is unclear, and for identifying precise entry structures, including order blocks, fair value gaps, and market structure shifts.
The 15-minute and 5-minute timeframes are used for entry confirmation only, never for bias. These lower timeframes show the final structure shift that triggers your entry within the higher timeframe zone.
Limitations of Order Flow Trading
Order flow trading is not without challenges. It requires a substantial learning curve and consistent screen time to master. The methodology requires patience because setups do not appear every hour. Traders who are accustomed to constant activity will find the waiting uncomfortable at first.
Additionally, not every liquidity sweep leads to a clean reversal. False structure shifts occur, particularly during high-impact news events that create erratic price behavior outside of normal institutional patterns. Managing this requires strong risk management and a willingness to accept that no strategy wins every trade.
The solution is backtesting. Building experience through historical chart study builds the pattern recognition needed to distinguish high-probability setups from noise. The more time spent studying how institutional order flow has played out across different market conditions, the sharper the execution becomes in live trading.
Common Mistakes in Order Flow Trading
Trading without a bias. Jumping into trades without first establishing the directional bias from the daily or H4 timeframe leads to low-probability setups. Every trade must start with a clear answer to the question: Which direction is smart money pointing?
Entering during accumulation. Many traders try to trade the range during accumulation, getting stopped out repeatedly before the real move begins. Accumulation phases are for observation, not trading.
Mistaking manipulation for the real move. The liquidity sweep during the manipulation phase looks like a breakout. Many traders enter in the direction of the sweep and get caught in the reversal. Always wait for the structure shift after the sweep before committing.
Ignoring higher timeframes. A perfectly valid H1 setup that conflicts with the daily order flow will fail more often than it succeeds. The higher timeframe always dominates.
Overtrading. Order flow trading rewards patience. The best setups are rare. Forcing trades in unclear conditions destroys the edge the methodology provides.
Frequently Asked Questions
What is institutional order flow in trading? Institutional order flow refers to the large buy and sell orders placed by banks, hedge funds, and other major market participants. Tracking these orders and the liquidity zones they target allows retail traders to align their trades with the direction smart money is pushing price.
How do you read order flow without footprint charts? GhostTraders’ approach reads institutional order flow directly from standard price charts by identifying liquidity pools, order blocks, fair value gaps, and market structure shifts. These patterns reveal smart money behavior without requiring specialized software.
What is the best timeframe for order flow trading? The daily timeframe establishes the primary directional bias. The H4 and H1 are used for setup refinement. Lower timeframes (15m, 5m) are used for entry confirmation only.
What is the difference between order flow and price action? Price action analyzes what price has done. Order flow analysis goes a step further by examining why price moved, specifically identifying the institutional activity and liquidity dynamics that drove it. Order flow is the cause; price action is the effect.
Is order flow trading suitable for beginners? Order flow trading has a learning curve, but the foundational concepts, including liquidity pools, directional bias, and the accumulation, manipulation, and distribution cycle, are learnable with dedicated study. GhostTraders provides structured courses that walk traders through the methodology step by step.

Conclusion
Institutional order flow trading gives retail traders the ability to align with smart money rather than being caught in its traps. By understanding how liquidity pools work, how institutions use the accumulation, manipulation, and distribution cycle, and how to read directional bias across multiple timeframes, traders can step out of the retail mindset and start thinking like the big players.
The edge is not in finding the perfect indicator. The edge is in understanding that price moves to liquidity, institutions engineer those moves deliberately, and every sweep, every structure shift, and every fair value gap left behind is a clue that tells you exactly where smart money is going next.
Follow the trail of liquidity. Trade with the institutional bias. Execute at the precise zones where smart money is active. That is order flow trading.